

|
SUMMARY:
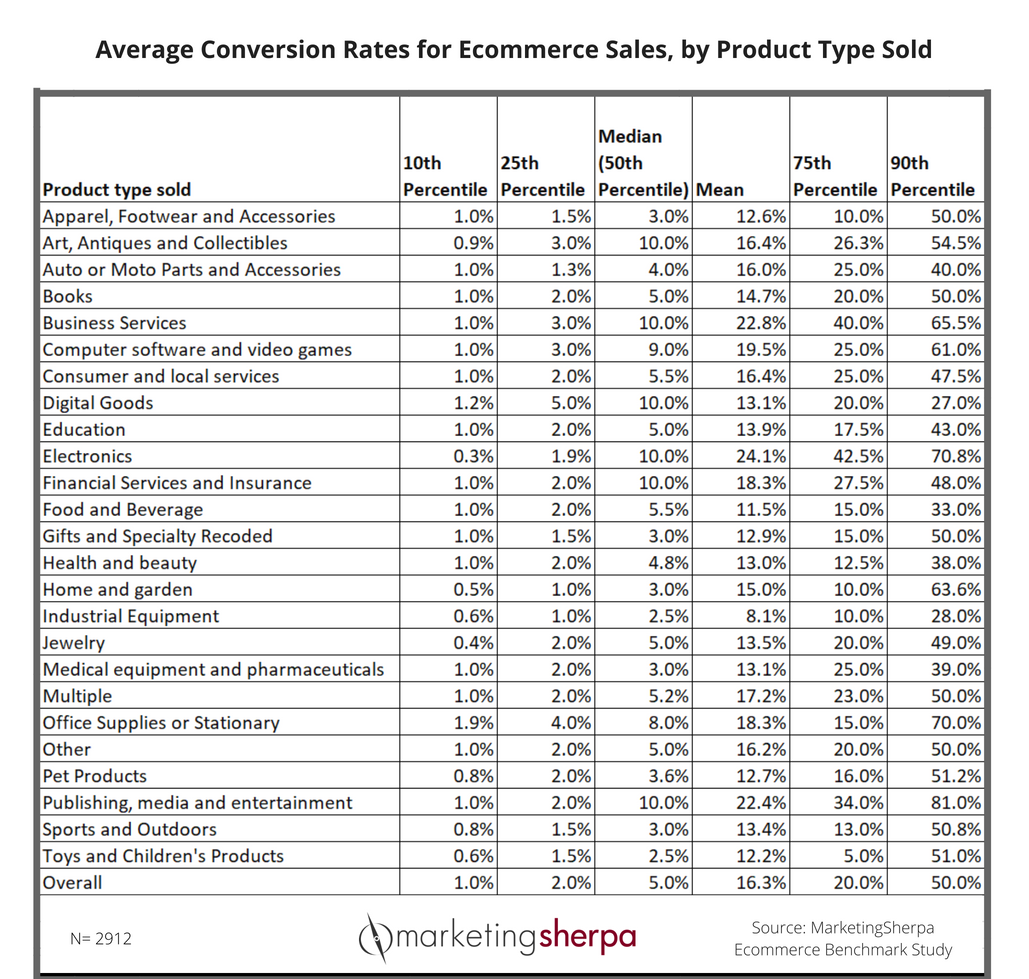
In our latest chart article, we’re sharing median conversion rates for 25 industries based on responses from 2,912 ecommerce marketers. Read on to see not only the median rates but also a range of percentiles to get a deeper understanding of competitors’ conversion along with a discussion of what your brand’s conversion rate should be. (As seen in the MarketingSherpa Chart newsletter. Click to get a free subscription to the latest research and case studies from MarketingSherpa.) |
Some articles just scream for a deeper exploration. Like this article – Ecommerce Research Chart: Industry benchmark conversion rates for 25 retail categories.
In that article, we published average conversion rates. It was originally published three years ago, and it’s still consistently getting traffic today. We had so many questions when we originally published it, we added a Chart Update with more information (just scroll down in the article to read it).
A MarketingSherpa email subscriber wrote in the other day with a detailed question that got me thinking we should publish a more in-depth chart of the data for the entire community.
The email subscriber asked, “The specific number I would be interested to get is the median conversion rate for the jewelry industry — if there is any way to get data for the jewelry industry or that particular number, it would be amazing, but I totally understand if it is not possible.”
The data in the below chart was originally collected during the research necessary to create The MarketingSherpa E-commerce Benchmark Study.
Q: What is your average conversion rate for e-commerce sales (%)?
To see 95 charts from the study, download the free report.
The data represents responses from 2,912 ecommerce marketers. You can see not only the mean (average) conversion rate we originally published for the type of product you sell, but also the 10th, 25th, 50th (median), 75th and 90th percentiles of average conversion rates. Three product categories were not included because they did not have enough responses.
The charts we publish on MarketingSherpa are a tricky balance. We’re publishing data, sure. But at the end of the day, what we’re really publishing is a communication mechanism that describes what the data can tell us. So we try not to confuse you with overly complex charts.
The downside though, as in the case with this original chart article, is there occasionally isn’t as much detail as a reader would prefer. Hopefully, publishing this more detailed chart allows readers to place themselves in context of the data.
The simple question without a simple answer
Marketers, along with their clients and business leaders, tend to want a straightforward answer — what should my conversion rate be? We all want a number to grade our efforts by, not to mention the efforts of the people and companies that work for us. Marketing isn’t unique in this aspect. For example, standardized testing in schools has been put in place because of the hunger for an easy-to-understand metric explaining performance.
It is comforting to have one all-encompassing number and say, “I’m doing better than that, so everything is just swell” or “Uh-oh, I’m less than that, I better step up my game” or even “That is my exact conversion rate, so everything is just right.”
But life is more complex than that. And so is ecommerce and marketing.
If you look at the data, you can see a large amount of variability between and within industries. For example, for companies that sell publishing, media and entertainment products, the 90th percentile is a whopping 81% conversion rate. However, the average (mean) is a much lower 22.4%, and the median (50th percentile) is an even lower 10%.
What should your store’s conversion rate be?
As Albert Einstein said, “True knowledge comes with deep understanding of a topic and its inner working.” That’s what you should be aiming for with your conversion rate. A lofty goal, I know.
This data can help you get a sense of what the neighborhood is like. And that’s a good place to start. But you want to drill down to exactly what happens on a particular street corner at a particular time by particular people.
In other words, don’t just understand your headline conversion rate and how it compares to your competitors.
Understand the levers you can pull to affect that conversion rate.
Do certain groups convert better than others? At certain times? From specific channels? On different areas of the website?
And most importantly, what can you learn from that? Perhaps a small group is converting very highly, and you really should be targeting and serving them better with your marketing efforts.
What is the buyer’s journey? What is the conversion rate at each step? Where might you be leaking revenue?
Experiment and test different changes you can make — to the offer, headline, copy, call-to-action, etc. — and start getting a sense of where there is room for improvement. What changes are resulting in large conversion rate gains (or losses)? Which changes provide results that are too small to validate a difference between the control and treatment?
In other words, a conversion rate really shouldn’t end the conversation. It should start a whole new conversation. A conversation within your marketing departments and with your agencies that leads to a better understanding of the customer, your product, and what changes you can make to positively impact results.
Related Resources
Conversion Optimization Reports & Testing Tools bundle — Download your free bundle instantly
Website Development: How a small natural foods CPG company increased revenue 10% with a site redesign — Food products supplier increased its ecommerce conversion rate with a website redesign
Ecommerce Chart: How a low conversion rate can be a good thing

Join our thousands of weekly case study readers.
Enter your email below to receive MarketingSherpa news, updates, and promotions:
Note: Already a subscriber? Want to add a subscription?
Click Here to Manage Subscriptions
Get Better Business Results With a Skillfully Applied Customer-first Marketing Strategy

The customer-first approach of MarketingSherpa’s agency services can help you build the most effective strategy to serve customers and improve results, and then implement it across every customer touchpoint.
Get More Info >MECLABS AI

Get headlines, value prop, competitive analysis, and more.
Use the AI for FREE (for now) >Marketer Vs Machine

Marketer Vs Machine: We need to train the marketer to train the machine.
Watch Now >Live, Interactive Event

Join Flint McGlaughlin for Design Your Offer on May 22nd at 1 pm ET. You’ll learn proven strategies that drive real business results.
Get Your Scholarship >Free Marketing Course

Become a Marketer-Philosopher: Create and optimize high-converting webpages (with this free online marketing course)
See Course >Project and Ideas Pitch Template

A free template to help you win approval for your proposed projects and campaigns
Get the Template >Six Quick CTA checklists

These CTA checklists are specifically designed for your team — something practical to hold up against your CTAs to help the time-pressed marketer quickly consider the customer psychology of your “asks” and how you can improve them.
Get the Checklists >Infographic: How to Create a Model of Your Customer’s Mind

You need a repeatable methodology focused on building your organization’s customer wisdom throughout your campaigns and websites. This infographic can get you started.
Get the Infographic >Infographic: 21 Psychological Elements that Power Effective Web Design

To build an effective page from scratch, you need to begin with the psychology of your customer. This infographic can get you started.
Get the Infographic >Receive the latest case studies and data on email, lead gen, and social media along with MarketingSherpa updates and promotions.
