by
Daniel Burstein, Director of Editorial Content
To understand which formats earn the most shares, BuzzStream and Fractl analyzed 220,000 pieces of content over six months using BuzzSumo.
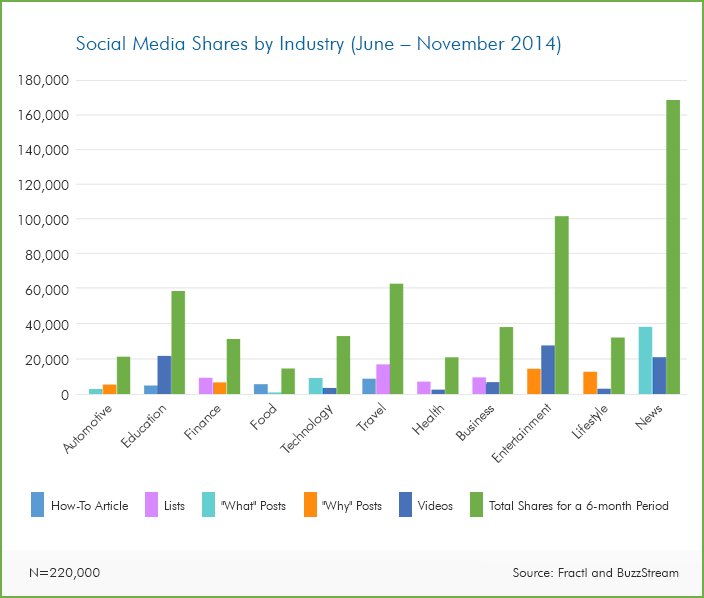
They provided the data to MarketingSherpa, and we created the below chart showing the most and least popular types of content for each industry.
Social Media Shares by Industry (June — November 2014)

Click here to see a printable version of this chart
An analysis of the types of content that get shared
To create the above chart, the teams at Fractl and BuzzStream divided content into five types to see which type of content was most frequently shared in each industry.
According to Andrea Lehr, Promotions Supervisor, Fractl, here is how they defined each type of social media post:
- How-to posts introduce a problem, offer a solution and then discuss each step to reach the desired result. (ex. "How to Develop Film and Print In the Darkroom")
- Lists focus on a particular topic, offer a number of points about the topic and provide a brief conclusion. (ex. "15 Great Landing Page Design Examples You Need to See")
- What-posts provide further information on a specific topic, with many articles surrounding comparisons of one thing to another. (ex. "What SEO Used to Be Versus What SEO Is Now")
- Why-posts typically provide readers with a reason or purpose and provide details that support a focused conclusion. (ex. "Why Introverts Now Rule the World")
- Videos provide the audience with a dynamic visual of the topic discussed within the article. (ex. "A Look at the Economy of the Future [Motiongraphic]")
The most helpful industries are the most successful on social media
The news industry had the most shares over this six-month period (167,679), followed by the entertainment industry (101,381).
Previous data we published from HubSpot (using different industry classifications) showed the
nonprofit/education industry had the most interactions per social media post.
The biggest lesson from both of these data sources, regardless of industry classification method, is that your social media content should put the customer's needs (i.e., get help, learn something, be entertained) ahead of your own (i.e., sell something).
In the HubSpot group of data, nonprofits — just by their very nature — were the most helpful industry in that grouping. For that reason, I don't think it was a coincidence that nonprofits were also the industry with the most interactions per social media post.
In the grouping of industries in the above chart, news is the most helpful.
After all, the reason news organizations exist is to provide noteworthy information about important events to customers (subscribers), and the industry has a rich heritage of putting the customer first. Editorial independence is baked into the product — the idea that the core function of the product is to serve the customers' best interests even when it would be more profitable (in the short term) and convenient to do otherwise (i.e., publish puff pieces about advertisers).
Customer-first social media marketing
Every industry should approach social media content with that news industry mindset — what is most helpful to our customers?
Take the food industry for example, which had the least social media shares (14,534) over this six-month period. There are many aspects of food that are helpful to potential customers:
- Recipes
- How to use more obscure food ("How to cut a kiwi")
- How to share their own food-related content ("How to take a great Instagram picture of the cake you baked")
- Background on where the food comes from ("How to raise an organic turkey")
Perhaps that's why how-to articles were the most shared content (5,568 over six months) from the food industry.
How does your audience want content?
It is also interesting to note that the data does not reveal a consistent best (or worst) content format across all industries.
For example, 'What Posts' were the most shared content created by technology brands (9,073 shares over six months), yet the least shared content for automotive brands (2,886 shares).
Ask your customers and potential customers what type of content would be most helpful from your brand. Take a look at what platforms and type of content your ideal customers most frequently shares. Then test (and iterate) to see what really works best.
You might also like
Subscribe to MarketingSherpa Chart of the Week — Gain access to the data and discoveries you need to better serve customers
Social Media Content Calendar (see more data from Fractl and BuzzStream's research)
Social Media Chart: Average interactions per post by industryHow to Apply Outreach Insights to Content Creation (by Joey Rearick at Fractl)
How We Turned an SEO Team into a Content Marketing Agency (by Kevin Gibbons on BuzzStream)
18 Expert Tips On Organizing Your Content Creation Process (by Henley Wing at BuzzSumo)
Social Media Marketing: AT&T Developer Program calendar strategy increases Twitter audience 136%, Facebook 113%


