June 02, 2015
Chart

Ecommerce Charts: Usability and conversion

SUMMARY: This week the MarketingSherpa team is running the MarketingSherpa Media Center at IRCE.

To help you prepare for this year's Internet Retailer Conference + Exhibition, let's take a look at some key pieces of data from previous Charts of the Week, including website usability and revenue growth, overall ecommerce conversion rates and conversion rate by retail category.
by Daniel Burstein, Director of Editorial Content

Right now the MarketingSherpa team is at IRCE in Chicago collecting tips and tactics from successful ecommerce marketers at the MarketingSherpa Media Center at IRCE to help you improve your ecommerce marketing.

We will be discussing two of the most impactful areas for improvement on many ecommerce stores with your successful ecommerce peers — usability and conversion rate optimization.

Driving traffic to a store through search engine marketing, print advertising, email marketing, display ads, price comparison engines and many other channels is necessary for ecommerce success.

However, once that traffic is on your site, usability and conversion rate optimization are key for ultimate success. Since so much of the budget is often invested in driving traffic to a site through those many channels, any investment in on-site optimization can have on outsized ROI.

Lesson #1: It's better to be proactive about site usability

The first habit of highly effective people, according to Stephen R. Covey, author of The 7 Habits of Highly Effective People, is to "be proactive."

It seems that the same could be said for highly effective ecommerce websites as well.

Customers have endless choices — both online and off — to purchase products in most categories. If your ecommerce site is not easy to use and doesn't serve the customer well, it will likely underperform.

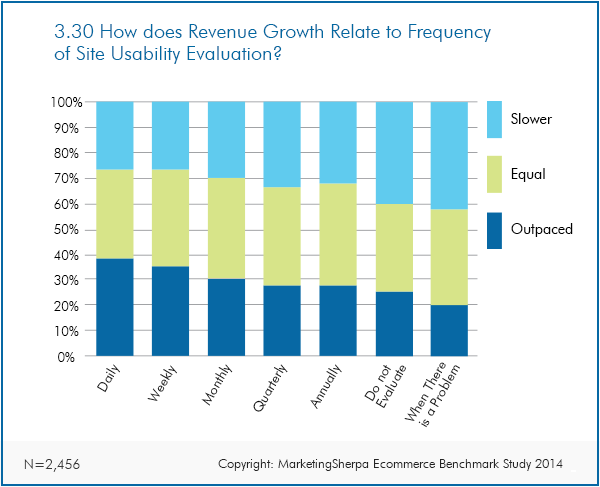
According to data collected from 2,456 ecommerce marketers in the MarketingSherpa Ecommerce Benchmark Study, companies that were reactive (only being concerned about ease of use when there was a problem) were less likely to meet revenue goals, with 40% of these marketers falling into the "slower than forecast revenue growth" group.

Q. How often do you evaluate the following aspects of your webpages or templates?

View Chart Online


Click here to see a printable version of this chart


You can read a full analysis of this data at "Ecommerce Research Chart: Website usability and revenue growth."

Optimizing for usability often goes hand-in-hand with optimizing for conversion. Let's take a look at some conversion rate data.

Lesson #2: Don't just focus on your current conversion rate — focus on how you can improve it

Marketers often want to know what average conversion rates are. Here is a quick snapshot of 2,912 ecommerce companies from the MarketingSherpa Ecommerce Benchmark Study:

Q. What is your average conversion rate for ecommerce sales (%)?

View Chart Online


Click here to see a printable version of this chart


The real challenge isn't understanding another company's conversion rates; it's getting a complete picture of your ecommerce store's conversion rates — and where in the customers' buying journey you have unoptimized conversion points that are hindering results.

For a full analysis, read "Ecommerce Research Chart: Overall conversion rates."

Lesson #3: Companies selling more products tend to have higher conversion rates … but not always

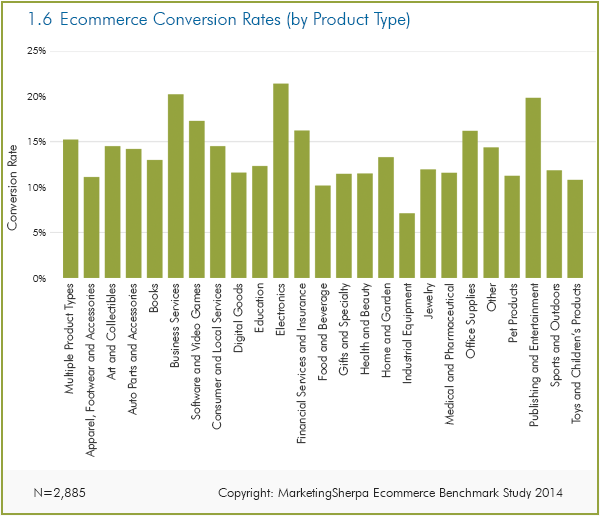
Zooming down from overall ecommerce conversion rates, let's take a look at conversion rate by industry. This is a better (but far from perfect) metric, since the type of product sold can have a big impact on conversion rates. Here's what we learned from 2,885 marketers about conversion rates by industry:

Q. #1. What is your average conversion rate for ecommerce sales (%)?

Q. #2. Which product categories does your organization sell through ecommerce? (Select all that apply)


View Chart Online


Click here to see a printable version of this chart


See full analysis at "Ecommerce Research Chart: Industry benchmark conversion rates for 25 retail categories."

Related Resources

MarketingSherpa Media Center at IRCE 2015

Subscribe to MarketingSherpa Chart of the Week — Gain access to data and discoveries to help you better serve customers and improve your marketing performance

Interviews with 39 brand-side marketers and ecommerce experts from IRCE 2014

MarketingSherpa Ecommerce Benchmark Study — Made possible by a research grant from Magento

Ecommerce Research Chart: ROI on marketing spend

Ecommerce: Moving beyond shopping cart abandonment nets 65% more checkout conversions


Improve Your Marketing

Join our thousands of weekly case study readers.

Enter your email below to receive MarketingSherpa news, updates, and promotions:

Note: Already a subscriber? Want to add a subscription?
Click Here to Manage Subscriptions


Todd /article/chart/usability-and-conversion-charts