

|
SUMMARY:
We live in inflationary times. Budgets are under pressure. So many organizations are trying to find ways to rein in costs. Good cost-cutting is like a sushi chef, slicing in just the right place to preserve (and maybe even strengthen) the essential. Bad cost-cutting is more like swinging a cleaver at the largest hunk of meat. In this MarketingSherpa article we discuss what to cut versus protect, where to recover wasted demand, and how to reallocate spend. |
Action Box: Custom AI Agent Builder
Train a custom AI agent on your site's content in under 90 seconds. No cost or registration to try the AI Agent Builder (from MeclabsAI, MarketingSherpa’s parent company).
Costs tend to build up over time, like barnacles on a ship. Everywhere your organization has gone you’ve likely picked up one or two. While we marketers are big fans of annual recurring revenue when we’re selling our own products, we are on the other side of the automated ARR bills when we put on the operations hat for our own business.
But things change over time – technology, team makeup, client needs. What used to be the best way of doing things three months ago may now be outdated and inefficient. And we’ve all seen organizations where software licenses went unused or vendors didn’t get attention (while still billing monthly retainers) simply because the employee in charge of it is no longer there.
And that’s if everything is going good.
If revenue heads south, you may have no choice but to cut costs, even for technology and vendors that are being used. It doesn’t mean they have no value – your company started spending money on them for a reason – but when you’re forced to make a tradeoff, what can go first?
This is why it helps to periodically look at all expenses with fresh eyes. Ask, ‘If we were forced to choose to pay this automatically recurring bill right now, is it of higher value than the other things we could be investing in?’
Here’s an approach to help you uncover these costs and prioritize what to keep and what to cut.
Review all bills and contracts, but also how your team spends its time (which is ultimately a cost as well). You could do a quick audit of where both money and time are going across:
Rank the value of each cost based on how it affects measurable performance (like conversion) or customer value. You might find human work that was necessarily a few years ago could easily be automated today. Or as your company has grown it has added in too many review layers that cause endless rework.
Here’s a simple three-question scorecard you can use to build your protected versus challenged cost list:
You’ll then end up with a list that has protected costs towards the top, and costs you want to challenge and better understand towards the bottom. Are these costs due to habit, politics, or a legacy process? Or, in fairness, is there some measure of value you’re overlooking at first glance?
You should decide how granularly you want to break down each category, because there may be both waste and value under the same line item in the budget. Here’s a worked example from Meclabs Institute (MarketingSherpa’s parent company). If AI is simply grouped into one cost, this savings opportunity will be overlooked.
In the scenario for this working example, a company wants an artificial intelligence system that can search a big knowledge base (think ~1 million records) and then recommend what to do next.
BEFORE
The common default is to let the AI do everything:
You could think of this as ‘AI Everywhere.’ Artificial intelligence performs the search and pulls full records into the prompt.
AFTER
A normal database does the search first, then the artificial intelligence only sees a small ‘evidence pack’ (like a summary), and the AI focuses on the Recommend step. This is a Hybrid approach.
RESULTS
The working example measured ‘cost per query’ (how much each search + answer costs) under the two designs, holding the answer length steady so it’s a fair comparison.
The AI Everywhere approach cost $8.80 per 1,000 searches. The Hybrid approach cost $4.65 per 1,000 searches. That’s a 47% cost reduction just from placing AI in the right part of the workflow.
You can read the full details of this working example here – Inside the architectural choice that pays for itself, then compounds.
Now that you know everything you’re spending money on, you want to make sure it’s working properly. In marketing, we tend to focus on the media and creative budgets. And we’ll cover those thoroughly in the following steps.
But all of that spend flows across your marketing infrastructure. If it doesn’t support execution, it hurts your ability to spend efficiently.
For example, let’s say there was a merger or acquisition in your company that resulted in your newly managed org using two separate ESPs with two separate accounts. You’ll find that wasted expense in Step #1. However, if you consolidate to one ESP and don’t update where all the forms are going or migrate recent opt-ins from one ESP to the other, you aren’t getting full return on all the other marketing activities you’re investing in.
Here’s another example of how you must fix your infrastructure to get the most of your strategy, production, and media costs by optimizing the source of truth before attempting to optimize ads.
Quick Case Study: CPA drops from $583 to $65 for premium meat subscription service after fixed tracking enables true learnings from A/B tests
BEFORE
Prior to February 2026, a premium meat subscription service had an average CPA of $583.
AFTER
A new team was brought on to evaluate the campaign. “Meta and GA4 data could not be trusted enough to scale aggressively,” explained Austin Lovvorn, managing partner and CEO, Orange Carrot Media (the subscription service’s growth marketing agency).
For example, InitiateCheckout was not consistently tracked because key checkout redirect handlers skipped tracking. So the team “added a trackAndRedirectToCheckout() helper firing Meta pixel, CAPI, TikTok, and GA4 before redirecting to checkout,” he said.
Lovvorn rattled off other challenges as well. “Shopify Customer Events custom pixel was disconnected, so some purchase attribution was missing. Three of four orders had _fbc values from Meta ads, but purchases were not tracked. There were also reporting pollution issues from $0 internal/influencer orders created in Shopify admin, which could get picked up by Meta and needed to be excluded.”
Once the team made fixes and confirmed that all tracking was set up correctly, then they could dive in to find ways to improve ad performance. They created a modular creative system with blocks: hook, product proof, offer, objection handling, testimonial/social proof, CTA.
This allowed them to run A/B tests and discover what ad creative worked best. Instead of making every ad from scratch, the team swaps blocks across winners.
The team also ran audience tests by holding the creative constant and varying only targeting – using both LeadEnforce-built audiences and a broad audience – in a new ABO (ad set budget optimization) campaign budgeted at $100–$200/day per ad set while leaving the winning CBO (campaign budget optimization) setup unchanged.
The improved tracking also enabled the team to improve the checkout flow. For example, users selected a meat box and then got hit with an add-on upsell step before reaching checkout. “Microsoft Clarity showed roughly 50% drop-off at that add-on step,” Lovvorn said.
RESULTS
A month after launching, the team brought the CPA down from $583 to $65.
Step #1 focuses mostly on business as usual – the typical ongoing monetary and time costs your company spends to keep operating. These tend to be fixed, consistent costs – if not in exact dollar volume, at least in the fact that they are an ongoing line item in your budget.
The biggest variable costs for most marketing departments usually occur in the channel – paid, organic, sponsorships, experiential, events, etc. – both for media spend and creative production.
Your first impulse might be to take out a red pen and simply slash through these numbers and lower them. But notice I use the word ‘control’ in the title of this article and not ‘cut.’ Because sometimes you have to spend money to ultimately save money. And in this case, the way to save is by patching a leaky funnel.
If you can do a better job of converting that attention you pay for, you can get more customers for the same amount of money. Or, with a higher conversion rate, you could cut the media budget but still get the same amount of business. So when you do take out your red pen and make a cut, you ensure you’re keeping the quality (in this case, leads and customers) flowing int your company.
Here’s an example.
Hottie Hair is a three-location hair salon and extension brand in Las Vegas with a staff of 21.
BEFORE
There was no automated follow-up when a customer started booking an appointment but didn't finish.
AFTER
The team built a homegrown cart-recovery system with a priority score to decide who should get a call from an owner or a personalized text message and who to just flow into an automated email and text series. The score considers:
Creative Sample #1: Abandonment priority scoring for Hottie Hair
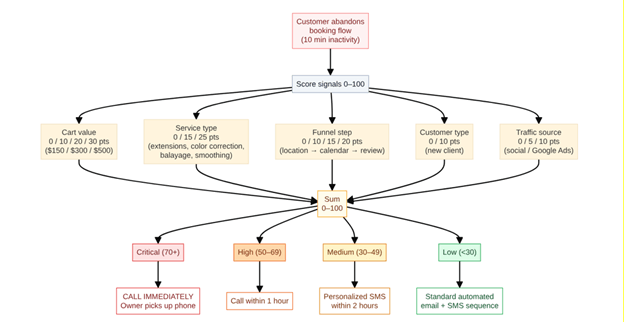
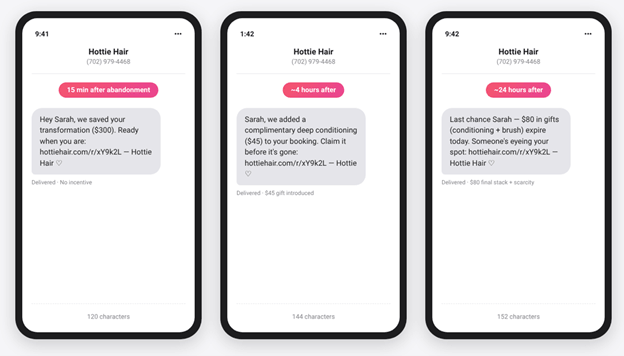
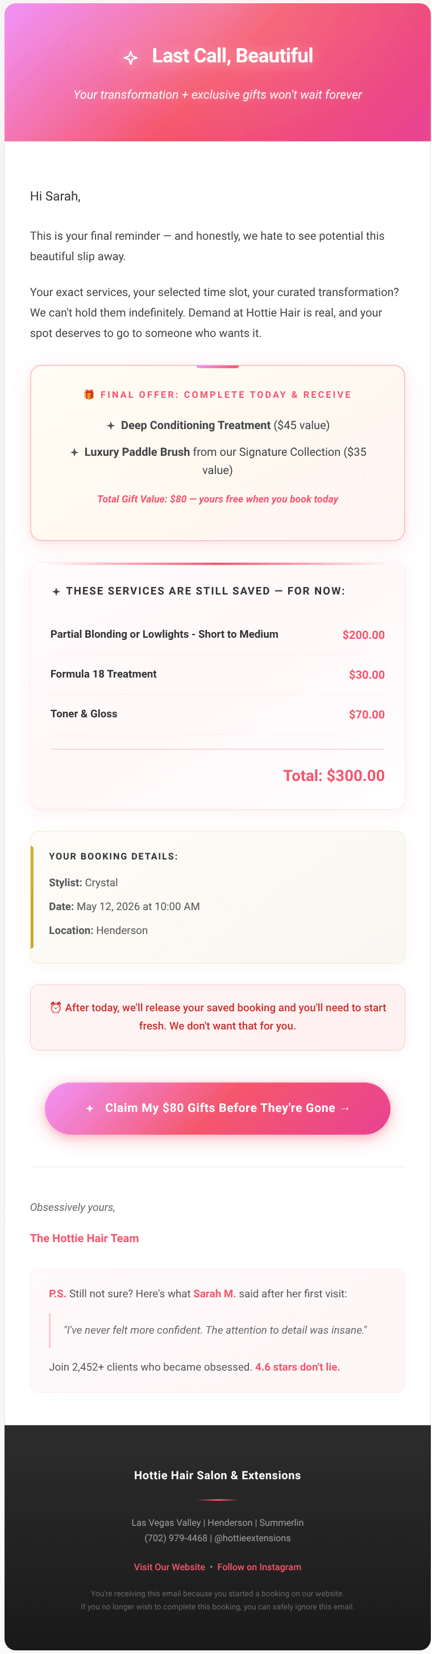
For the automated sequences, if the abandoned cart value is $250 or more, the prospect gets a six-touch email and text sequence (three emails and three texts) over the first 24 hours after abandonment. The first email and text touches are a simple reminder with no incentive. The next touches offer a $45 deep-conditioning gift. And the final touches offer an $80 conditioning plus a luxury-brush gift.
Creative Sample #2: Recovery SMS sequence (three messages over 24 hours)
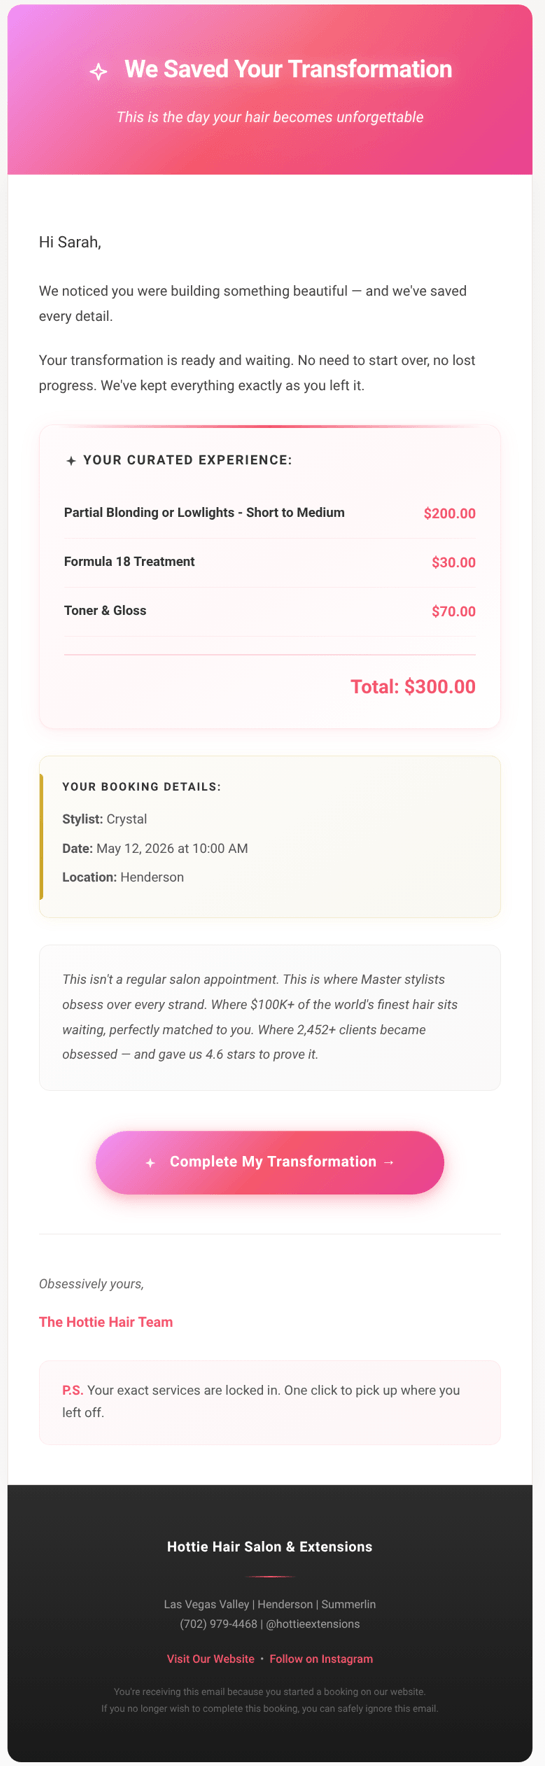
Creative Sample #3: Warm email reminder (first email in sequence)
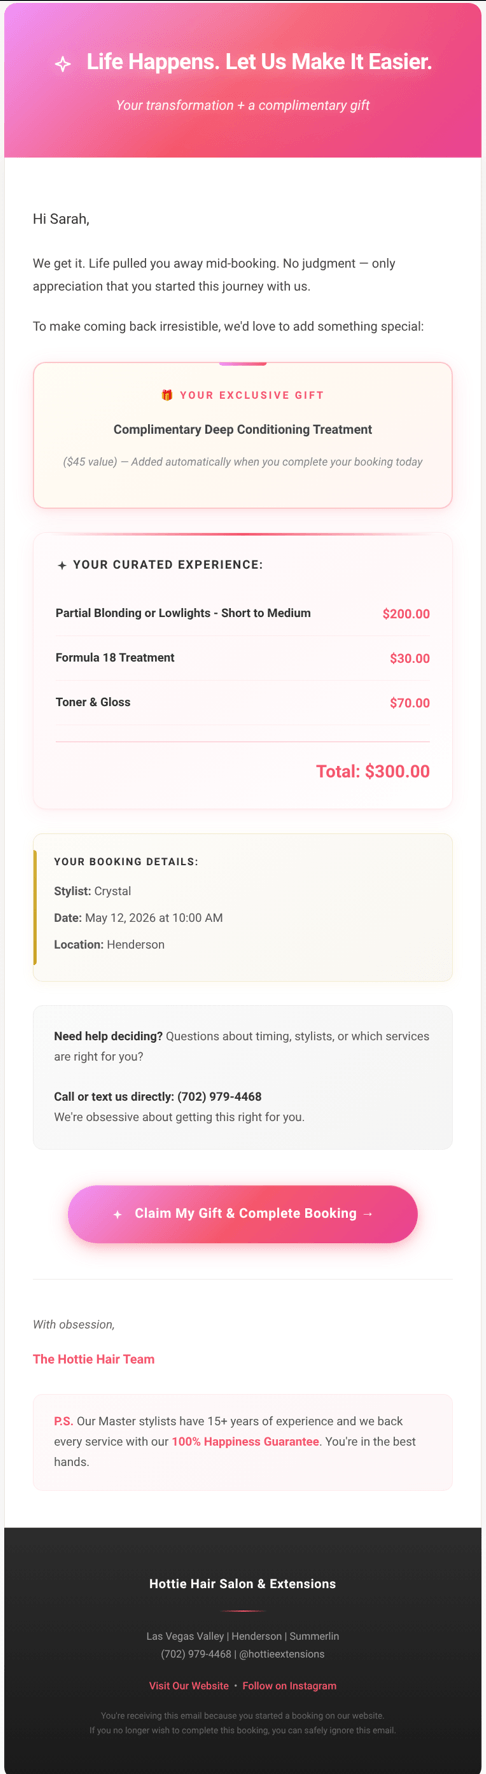
The team picked the incentives based on cost of goods sold (COGS) and perceived value. The deep conditioning has a COGS of $40 and the conditioning plus brush stack has a COGS of $80.
Creative Sample #4: Gift offer (second email in sequence)
Creative Sample #5: Final gift offer with urgency statement (third email in series)
Anyone with a cart value under $250 gets a non-monetary offer instead – like priority scheduling – so they don't train customers to abandon cart for the freebie.
RESULTS
Here are the numbers from the system’s first three months of operation:
The recovery rate was 17.37% (60 of 346) when prospects received both email and SMS versus 6.4% (3 of 47) when prospects only received email. It may be that SMS is a higher-converting way to reach people, but take that 2.7x lift with a grain of salt – it may simply be that more motivated prospects gave SMS consent.
Since the company’s CEO has an engineering background, the system is homegrown. Run cost is in the tens of dollars a month for email and text volume. There's no platform fee, no per-customer pricing, and no monthly seat charge. So it takes very little for the system to ROI.
“The all-in monthly software cost is under $25. Resend free tier plus existing RingCentral line plus existing Supabase plus existing Vercel. No marketing-automation SaaS,” said Mike Frehner, CEO, Hottie Hair. He estimates it took him 80 hours to build and three hours per month to maintain.
Even if you don’t have the same capabilities in-house, you could run a similar system with off-the-shelf tools and see if you can get an ROI by making more efficient use of all of the prospect attention your company has already invested in.
Once you’ve got your company’s funnel finely tuned, then you can evaluate your new demand generation efforts.
Cost control isn’t only about cutting. It’s also about reallocating…or allocating most efficiently to begin with. And this efficiency requires market clarity.
Once you’ve optimized everything that happens in your funnel when you receive traffic, you’ll see clearer signals about where your spend to drive traffic is actually working.
Then you can reduce investment in low-performing channels and placements, shift spend toward messages and offers that perform better, and double down on channels and assets that keep producing.
This is how you preserve quality while reducing cost – you focus on the parts that reliably attract the ideal customer and create value for the customer value while reducing or avoiding the parts that do not.
At first blush, it may feel like your industry or niche is inherently crowded with larger, more established competitors that flaunt bigger budgets than you. I hear this lament from a lot of marketers and entrepreneurs. But if you approach with a curious mind and experiment your way in (your first or even second bet may not pay off), you often can find at least a small gap to wedge your brand into.
Here’s an example of how a totally new brand found two key gaps in an already crowded market.
En Beauty was a new boutique beauty salon entering a crowded market in Auckland, New Zealand.
BEFORE
It had zero online presence or brand recognition and did not have a big budget to generate awareness.
AFTER
“We started with competitive intelligence,” said Jake Siddall, founder, Kyttn (En Beauty’s marketing consultancy). “SEMrush for organic rankings and estimated competitor ad spend, Google Keyword Planner for validated New Zealand search volumes, live SERP checks, and manual AI platform testing.”
The team mapped every competitor in the Auckland beauty space:
The team discovered two key gaps. Established competitors were all targeting the same small cluster of generic terms while a significant group of high-intent, service-specific terms had real volume and no competition. And none of the Auckland beauty competitors had any deliberate AI search presence. “Not one was being consistently recommended by ChatGPT or Gemini,” he said. That gap was wide open.
“Then we built the minimum viable marketing machine: brand, website, and Google Ads pointed at the demand that already existed,” Siddall said. Here’s a step-by-step look at how the team executed:
RESULTS
The campaign launched on August 24, 2025. Here are some results the team achieved with this approach:
In terms of cost, “the only paid channel was Google Ads,” Siddall said. First 30 days of ad spend was NZD $673 and the latest month was NZD $1,207. The brand, website, and strategy were all built by Siddall as part of his equity stake in the business.
“Most businesses skip phase one entirely,” he said. “They jump straight to building brand and creative without ever mapping their competitors or understanding where the gaps are. And then there are the ones who jump straight to pouring money into awareness campaigns, essentially building a race car in the completely wrong spec for the race they're in.”
I heard of a major brand that had a very focused approach for compensating its customer acquisition and retention teams. You’ve probably heard a story like this before. The acquisition team was compensated on only one metric – new customers.
I’m sure you can guess what happened next. They did a great job at bringing in a lot of customers (expensively), and many of those customers did not stick around. For example, using a super low promo rate for the first three months before the real cost kicked in.
When you’re putting together your measurement plan, make sure you consider the downstream impacts. This is especially true when it comes to measuring expenses. If you only track cost metrics, you’ll optimize toward the cheapest activity. Instead, track pairs of cost-value metrics.
Here are some examples to get you thinking:
For example, for your advertising spend, you want to look beyond early ‘lead’ numbers and make sure the budget goes toward qualified traffic and real business outcomes. Here are two real-world examples.
BEFORE
A B2B electronics recycler focused on cost per lead in its lead reports.
AFTER
Over the years the team got more sophisticated and started uploading offline conversions to Google to identify which leads drive meaningful business outcomes.
“With Google Ads you can import offline conversions, so you can see which leads resulted in real customers and have attribution to the appropriate keyword and campaign,” explained Ben Lund, founder, Rise Marketing Group (the recycler’s marketing agency).
The team discovered that while the original campaigns were great at driving leads, many were not qualified. They were getting individuals looking to recycle a few computers, not businesses who are their ideal customer.
RESULTS
Since optimizing with conversion-based bidding and focusing on offline conversions, the team attracts more B2B leads with larger hardware recycling needs.
This isn’t only a concern for brands with offline conversions. You could be facing a similar attribution challenge even if your campaigns and customer acquisition are entirely digital.
“A conversion path may touch multiple channels. If you only look at the data reported on each platform (i.e. Google, Meta, Microsoft), it will appear there are more sales than actually happened, as each platform is taking credit for the shared attribution,” Lund explained. “Our dashboards have evolved. [Now,] everything is custom in Google Data Studio, linking multiple data connections to show the full impact of our advertising.”
BEFORE
Historically, the team focused on cost per lead, trying to maximize volume at a low CPL.
AFTER
Over time, the company shared business revenue with the team at Rise Marketing Group (also the B2B financial company’s agency). When they tied the revenue data back to the campaigns, many of the ‘top performers’ in Google with low CPLs weren’t the best from a true business impact.
RESULTS
Now the team can assess which campaigns are driving real business outcomes and optimize budget towards these.
“If you're focusing on maximizing leads, Google, Meta, etc. are really good at that. But it doesn't mean these are qualified leads. Closing the loop and optimizing towards real business outcomes changes everything,” Lund said.
This article was distributed through the free MarketingSherpa email newsletter.
Reprioritize Your Marketing Spend and Transform Your Results: Learn a radical new framework
Marketing Budget Chart: Is budget size the real challenge? Or is it how you allocate your budget?
Marketing Case Studies: Real-world examples of 3 low-cost marketing strategies you can implement now
This is a human conceived and written article, assisted by AI. MeclabsAI was used to review source pitches for artificial intelligence, craft follow up questions to sources, brainstorm the steps of this article, and make copy edit suggestions for the article.

Join our thousands of weekly case study readers.
Enter your email below to receive MarketingSherpa news, updates, and promotions:
Note: Already a subscriber? Want to add a subscription?
Click Here to Manage Subscriptions
Get Better Business Results With a Skillfully Applied Customer-first Marketing Strategy

The customer-first approach of MarketingSherpa’s agency services can help you build the most effective strategy to serve customers and improve results, and then implement it across every customer touchpoint.
Get More Info >MECLABS AI

Get headlines, value prop, competitive analysis, and more.
Use the AI for FREE (for now) >Marketer Vs Machine

Marketer Vs Machine: We need to train the marketer to train the machine.
Watch Now >Live, Interactive Event

Join Flint McGlaughlin for Design Your Offer on May 22nd at 1 pm ET. You’ll learn proven strategies that drive real business results.
Get Your Scholarship >Free Marketing Course

Become a Marketer-Philosopher: Create and optimize high-converting webpages (with this free online marketing course)
See Course >Project and Ideas Pitch Template

A free template to help you win approval for your proposed projects and campaigns
Get the Template >Six Quick CTA checklists

These CTA checklists are specifically designed for your team — something practical to hold up against your CTAs to help the time-pressed marketer quickly consider the customer psychology of your “asks” and how you can improve them.
Get the Checklists >Infographic: How to Create a Model of Your Customer’s Mind

You need a repeatable methodology focused on building your organization’s customer wisdom throughout your campaigns and websites. This infographic can get you started.
Get the Infographic >Infographic: 21 Psychological Elements that Power Effective Web Design

To build an effective page from scratch, you need to begin with the psychology of your customer. This infographic can get you started.
Get the Infographic >Receive the latest case studies and data on email, lead gen, and social media along with MarketingSherpa updates and promotions.
