Every December, MarketingSherpa conducts an exclusive study of ad:tech trade show attendees. Concentrated mainly in the consumer advertising industry, these marketers represent many of the biggest Internet spends.
In fact, this year's 332 study respondents said they spent 47% of their budgets online in 2006, and plan to up that to 49% of budget for 2007. How did last year's campaigns work out, and what will they be testing this year? Check out these new charts:
(Note: Please do not copy these charts to post elsewhere - that's breaking our copyright. You can hotlink to this page, however. Thanks)
Chart #1. Search & Email Marketing ROI Compared: 2005-2006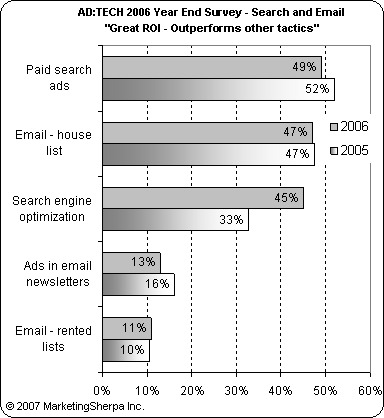
For the 4th year in a row, search and house list email are neck and neck when it comes to ROI (return on investment.) A few years ago, we would have said this is similar to comparing apples to oranges. Back then, everyone thought of search as a new customer (or new traffic) acquisition tool and email to one's own list as a "relationship tool" to past and current customers.
Although this is still somewhat true, house email is definitely more "preaching to the choir" than search is, the lines of new vs. old customer are blurring. Too many consumers who know your brand, know your URL, have bought from you before, and even who are on your email list, turn to search engines to get to your site. Search engines have replaced "bookmarks" as the way many consumers find favorite sites. Which explains why mega-brands, such as eBay are still investing so many millions in search.
Your best use for this chart? We see two of them. First, use this data to help convince upper management they should invest more in email and search optimization (SEO), two tactics that most marketers are significantly under-budgeted in. The ROI is there, so why not the budget?
Second, consider testing email ads and rented lists (obviously on a very permission-based basis.) Just because you don't hear much press around email rentals and ads doesn't mean they are not working gangbusters for some marketers -- in our experience the ones who test incessantly, measure all the way through to conversion, and watch list quality like hawks.
Chart #2. Online Advertising Tactics ROI Compared: 2005-2006
Oh, how the mighty have fallen! As you can see from the chart above, last year everyone thought rich media ads (ads with video and/or audio, often based in Flash) were the cat's meow. Now folks are cutting back expectations.
We suspect that the rise of video ads -- which you could call Son of Rich Media or Rich Media Episode II -- is the force behind rich media's loss in popularity. Keep reading to see data on that front.
Chart #3. Online Ad Budget Increases by Tactic for 2007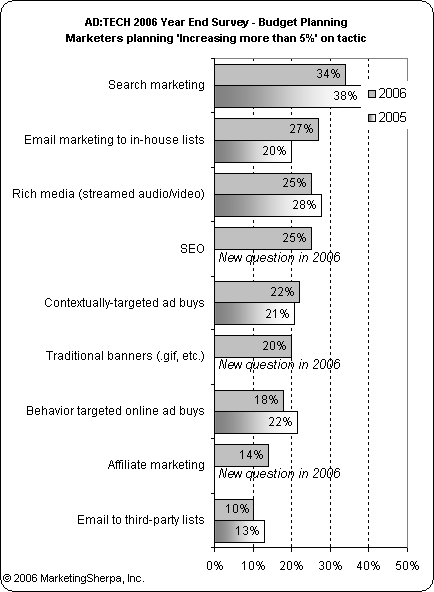
Yet again, more of the heavy online advertiser population plan to increase paid search advertising more than any other tactic. Actually, given the way average cost per click has been rising year over year, this may be less campaign expansion mode and more reality-setting-in. This year, we also asked respondents about SEO (optimization), and were glad to see some healthy increases budgeted.
We're happily surprised to see house list email making headway as the only significant increase in expenditure for 2007. This explains why so many ESPs are showing up on INC 500 and on other fastest growing tech company charts these days.
Chart #4. Analytics Tests & Tech Planned by Heavy Online Advertisers: 2007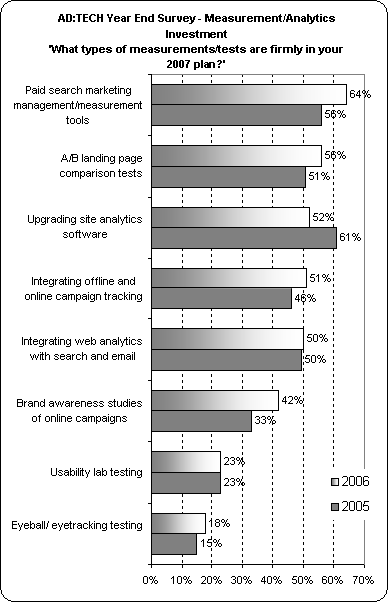
The biggest email vendor trend of the past year has been a scramble for integration with other measurement systems - especially Web analytics. We've noted partnerships and M&As sprouting all over the landscape. The execs behind those deals will be relieved to see that big advertiser interest in integrating their data remains equally as strong.
Aside from media (or list) targeting, landing pages are the most influential factor in the success of an online campaign. That explains why year after year these heavy Internet advertisers say they'll be making significant investments in landing page tests.
This is the first year that brand awareness studies really took off as a must-do on this chart. We suspect it’s because even the heaviest online advertisers are investing in multichannel campaigns -- especially broadcast -- that are not as easy to track as online. When marketers who are addicted to Web analytics intersect with offline campaigns, more perception studies are funded as a result.
Chart #5. Web 2.0 & Emerging Ad Tactics Planned by Heavy Online Advertisers: 2007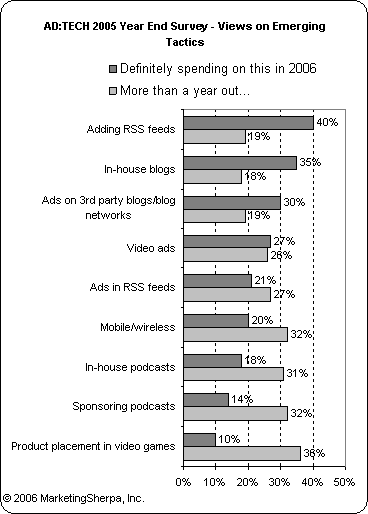
How much of the trade press buzz around Web 2.0, in-game ads, and online video is just hype? We asked these heavy Internet advertisers who, as we note above, are addicted to investing in measurable results, which of these hot tactics they're investing in.
Key -- check out the difference between what they told us they would be testing in 2006 vs. what they decided was worth budgeting for 2007. The biggest gaps often reflect tests that did far better or worse than hoped.
Also, gaps for blog advertising and video ads may be more a reflection of media availability. 12 months ago, it was harder to roll out video ads or ads on blogs across millions of impressions than it is now.
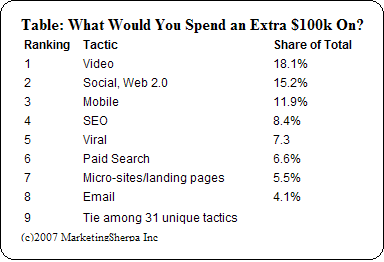
Here are the results to our favorite question -- "How would you spend $100,000 if your CEO or client said, 'Spend this on something new that might be a home run?'"
If the sectors of the US economy pick up more than expected, these are the tactics that heavy online advertisers will invest any extra windfall budgets in. But, will these tactics really work? Stay tuned for next year's ad:tech study results….
Useful links related to this storyad:tech
http://www.ad-tech.com


